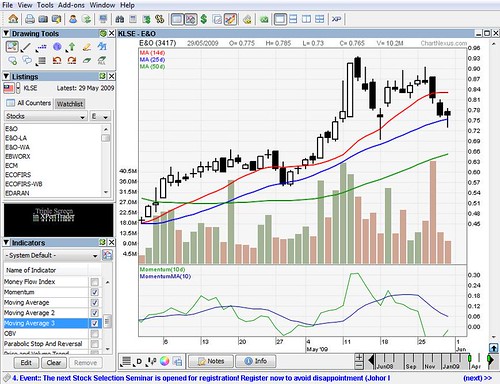
ChartNexus is a stock analysis software that runs in Windows Operating Systems. It is a tool more to technical analysis than fundamental analysis. I used this software long time ago but stopped for a long period due to my journey to New Zealand. I’m now re-learning to use this software again and maybe can learn to create my own “formula” to buy stock.

It is a pretty good software, written in Java language and runs like a normal Windows application where it’s performance is pretty impressive. The software itself is free. The use the software, you will need to signup as a member at ChartNexus website, activate your account and download & install the ChartNexus.
If you have install Java Plugin before in your PC, you can download the setup program without Java installer (3.45Mb) which is much smaller than the full version with Java installer (16.9Mb).
The software is not only for beginner because many professional can use the tool to test their own “formula” too by using the XPertTrader in ChartNexus. XpertTrader allow you to test your own defined formula against the historical stock data.Â
When you first installed the software, you can download past 3 years stock data for free. The stock market data available are such as BSE (India), Bursa (Malaysia), SGX (Singapore), US markets – AMEX, NASDAQ & NYSE. If you have installed the software 10 years ago, the you can test your formula against 10 years’ stock data for free. Anyway, you can also buy the historical data from ChartNexus too.

Below are some of the features comes with ChartNexus:
- Free End-of-Day (EOD) daily updates and 3 years of historical data
- Multi-window charting system to let you arrange chart as you wish; your computer is your limit
- BSE (India), Bursa (Malaysia), SGX (Singapore), US markets – AMEX, NASDAQ & NYSE
- World indices
- Comprehensive list of popular indicators
- Customize your own indicators parameters
- Create multiple indicators of the same kind e.g. MA10, MA14, MA20 etc. on the same chart
- Tools for doodling, drawing shapes, trendlines, lines, arrows
- Various ways to zoom in and out of chart
- Linear and logarithmic price scales
- View the equity in different period : daily, monthly chart
- Fibonacci retracements, fan, arcs and timezones
- Various chart types : bar, line and candlesticks
- Search tool to easily search for the equity of interest by name or code
- Workspace to save your notes and settings
- Management tools for managing your workspaces
- Data downloader that automatically download and update your data daily
- Portfolio manager to keep track of your trades
- Watch list to monitor your equities
- Spread calculator to easily calculate profits and losses
- Brokerage fee calculator
- Chart comparison tool to compare stocks against index, index against index basically any combinations you like
- Short description of the company and its business; some simple financial ratios too
- Color settings customization for charts, indicators, background etc.
- Printing chart capability
- Automatic software updater to check the latest updates
Check more at ChartNexus.